


How to Build a KPI Dashboard for Your Business in Excel (Free Template)
Learn how to build a professional KPI dashboard in Microsoft Excel—even if you’ve never created one before.
What is a KPI Dashboard?
A Key Performance Indicator (KPI) Dashboard is a single screen that displays the most important numbers about your business, such as sales, profit, expenses, customers, and orders.
Instead of searching through multiple spreadsheets, a dashboard helps you see how your business is performing at a glance and make faster, data-driven decisions.
What You’ll Build
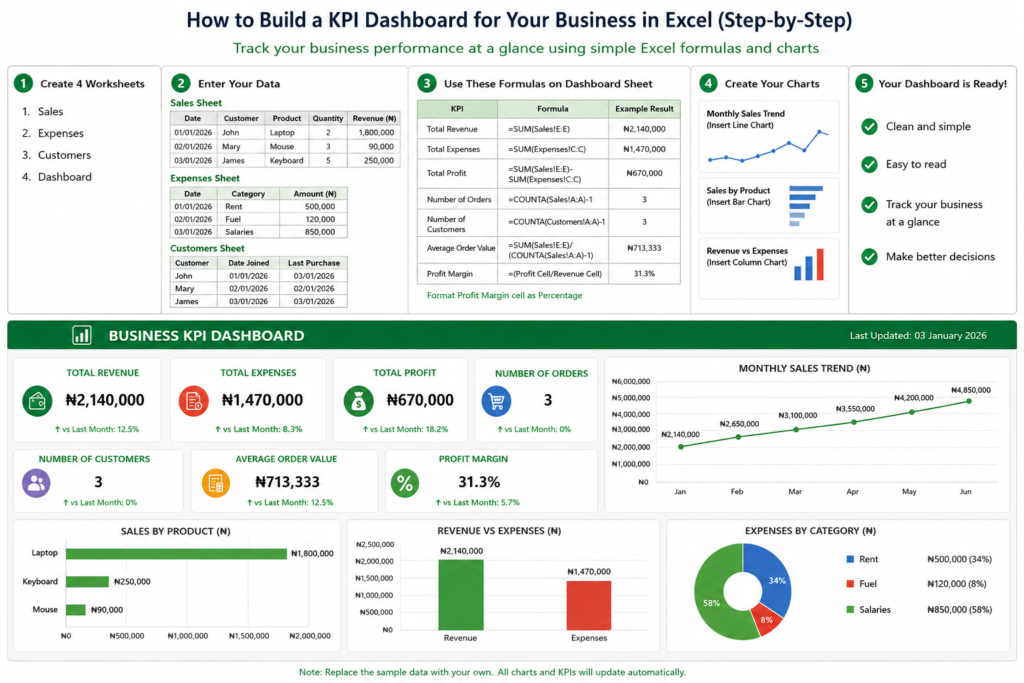
By the end of this tutorial, you’ll have a dashboard like this:
- Total Revenue
- Total Expenses
- Total Profit
- Number of Orders
- Number of Customers
- Average Order Value
- Profit Margin
- Monthly Sales Chart
- Sales by Product Chart
- Revenue vs Expenses Chart
Step 1: Create Four Worksheets
Create these sheets in Excel:
- Sales
- Expenses
- Customers
- Dashboard
Step 2: Enter Your Data
Sheet 1 – Sales
Date | Customer | Product | Quantity | Revenue (₦) |
01/01/2026 | John | Laptop | 2 | 1,800,000 |
02/01/2026 | Mary | Mouse | 3 | 90,000 |
03/01/2026 | James | Keyboard | 5 | 250,000 |
Sheet 2 – Expenses
Date | Category | Amount (₦) |
01/01/2026 | Rent | 500,000 |
02/01/2026 | Fuel | 120,000 |
03/01/2026 | Salaries | 850,000 |
Sheet 3 – Customers
Customer | Date Joined | Last Purchase |
John | 01/01/2026 | 03/01/2026 |
Mary | 02/01/2026 | 02/01/2026 |
James | 03/01/2026 | 03/01/2026 |


Step 3: Build the Dashboard KPIs
Open the Dashboard sheet and create the following KPI cards.
KPI | Formula |
Total Revenue | =SUM(Sales!E:E) |
Total Expenses | =SUM(Expenses!C:C) |
Total Profit | =SUM(Sales!E:E)-SUM(Expenses!C:C) |
Number of Orders | =COUNTA(Sales!A:A)-1 |
Numberof Customers | =COUNTA(Customers!A:A)-1 |
AverageOrder Value | =SUM(Sales!E:E)/(COUNTA(Sales!A:A)-1) |
Profit Margin | =(Revenue Cell-Profit Cell)/Revenue Cell (or Profit ÷ Revenue, formatted as %) |
Example Results
KPI | Value |
Revenue | ₦2,140,000 |
Expenses | ₦1,470,000 |
Profit | ₦670,000 |
Orders | 3 |
Customers | 3 |
Average Order | ₦713,333 |
Profit Margin | 31.3% |
Step 4: Create Your Charts
Charts make trends easier to understand than tables.
A. Monthly Sales Trend
Create a helper table:
Month | Revenue (₦) |
Jan | 2,140,000 |
Feb | 2,650,000 |
Mar | 3,100,000 |
Apr | 3,550,000 |
May | 4,200,000 |
Jun | 4,850,000 |
Select the table and go to Insert → Line Chart.
Monthly Sales Trend
Example sales trend for a small business.
₦1.7M₦2.6M₦3.4M₦4.2M₦5.1MJanFebMarAprMayJun
B. Sales by Product
Create a Pivot Table:
- Rows: Product
- Values: Sum of Revenue
Then insert a Bar Chart.
C. Revenue vs Expenses
Create this summary table:
Category | Amount (₦) |
Revenue | 2,140,000 |
Expenses | 1,470,000 |
Insert a Column Chart.


Step 5: Design Your Dashboard
Use large fonts (24–36 pt) for KPI cards, bold headings, and a clean white background. Add conditional formatting to highlight performance:
- Green: Above target
- Amber: Near target
- Red: Below target
Arrange everything neatly on one screen:
+————————————————————-+
| BUSINESS KPI DASHBOARD |
+————————————————————-+
Revenue Expenses Profit Orders
₦2,140,000 ₦1,470,000 ₦670,000 3
Customers Avg Order Profit Margin
3 ₦713,333 31.3%
—————————————————————
Monthly Sales Trend (Line Chart)
—————————————————————
Sales by Product (Bar Chart)
—————————————————————
Revenue vs Expenses (Column Chart)
+————————————————————-+
Best Practices
- Keep your dashboard to one page.
- Track only 5–10 meaningful KPIs.
- Separate your raw data from the dashboard.
- Use charts instead of large tables.
- Update your data regularly (daily, weekly, or monthly).
- Always display the Last Updated date.
Conclusion
A KPI dashboard doesn’t have to be complicated. With four worksheets, a few Excel formulas, and simple charts, you can build a powerful dashboard that helps you monitor your business at a glance.
Whether you run a retail shop, school, clinic, restaurant, church, or small business, a well-designed KPI dashboard will help you make better decisions, spot trends early, and measure progress towards your goals.
IN CASE YOU WANT TO BUILD ONE AND YOU NEED US TO HANDLE IT FOR YOU, CONTACT DR ANALYZER NOW WHATSAPP +2348028855788
SUMMARY




No responses yet