

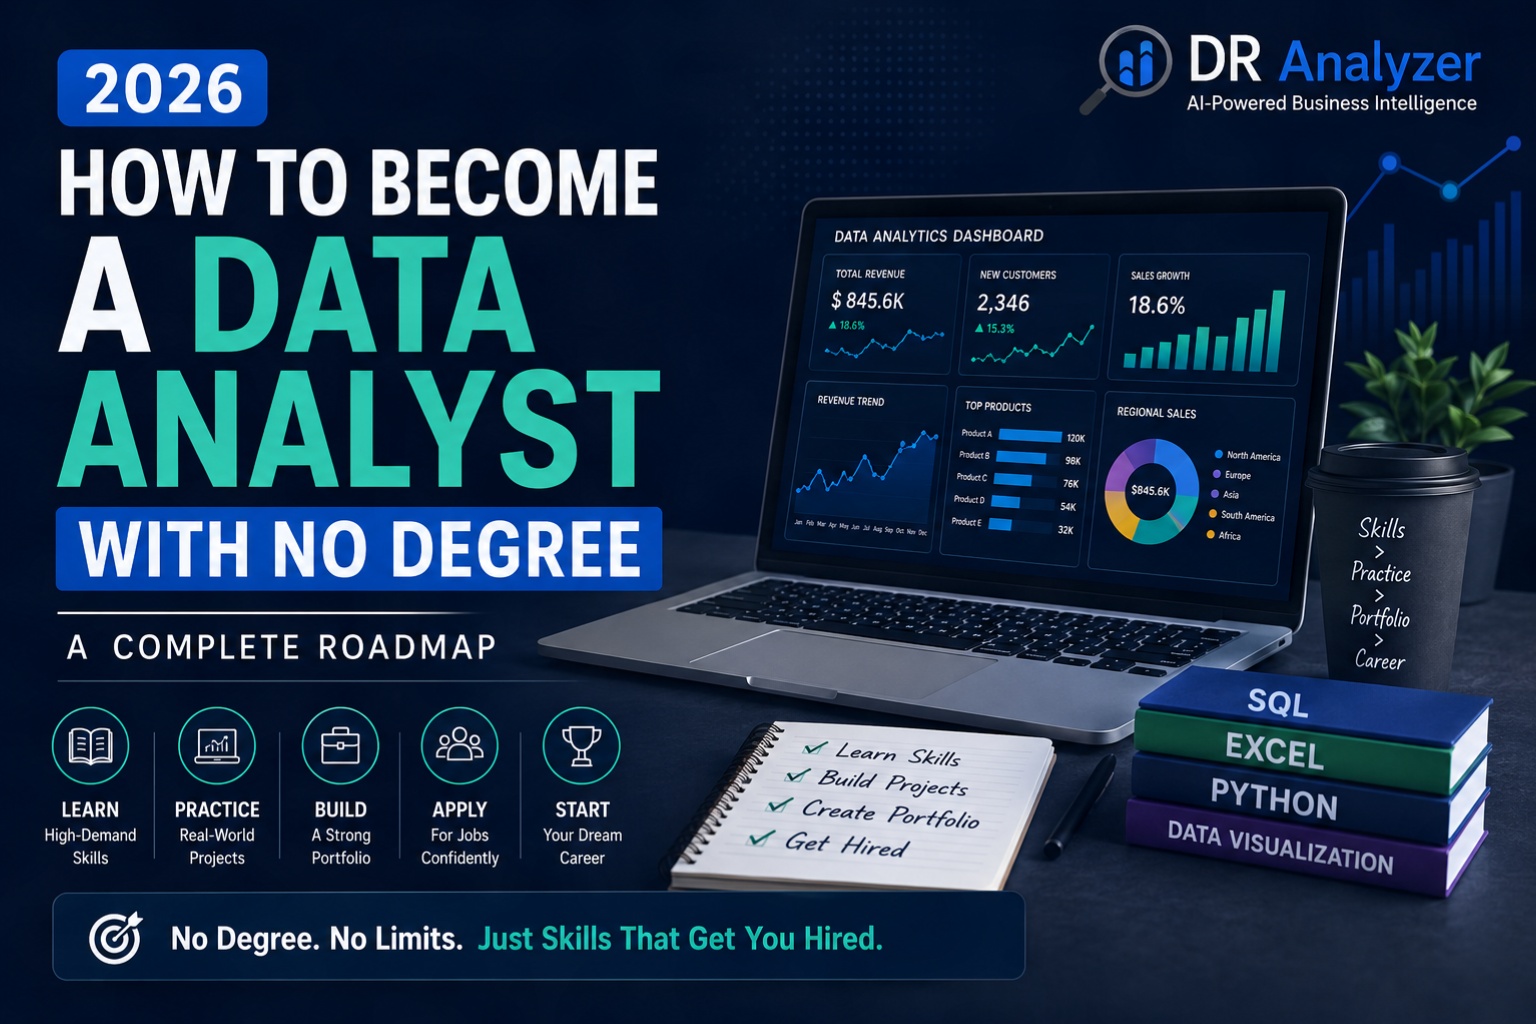
How to Become a Data Analyst with No Degree in 2026 (Complete Roadmap)
You can become a data analyst in 2026 without a university degree. Employers care far more about your skills, portfolio, and ability to solve real business problems than about a diploma.
This guide gives you a step‑by‑step roadmap, the exact tools to learn, project ideas, and job‑search strategies tailored for 2026—especially if you’re starting from scratch or switching careers.
Is It Really Possible to Become a Data Analyst Without a Degree?
Yes. In 2026, many companies hire data analysts based on:
Demonstrated skills in SQL, Excel, Python, and BI tools
A strong portfolio of real projects
Clear communication of insights and business impact
Certifications and practical experience instead of formal degrees
Job postings increasingly focus on “skills and experience” rather than “degree required,” especially in startups, tech firms, and remote‑first companies.
What Does a Data Analyst Actually Do?
Before diving into the “how,” it helps to know the role.
A data analyst typically:
Collects and cleans data from databases, spreadsheets, and APIs
Writes SQL queries to extract and transform data
Builds dashboards and reports in tools like Power BI, Tableau, or Looker
Analyzes trends to answer business questions (sales, marketing, operations, etc.)
Communicates findings to non‑technical stakeholders through visuals and stories
If you enjoy solving problems with numbers and telling stories with data, this career can be a great fit—even without a degree.
Step 1: Build the Core Skills (No Degree Needed)
Focus on a small set of high‑impact skills first. You don’t need to learn everything at once.
1. Excel / Google Sheets
Start here if you’re a complete beginner.
Learn to:
Use formulas (VLOOKUP/XLOOKUP, INDEX–MATCH, SUMIFS, etc.)
Create pivot tables and pivot charts
Clean and structure raw data
Build simple dashboards and reports
Free resources:
YouTube: “Excel for Data Analysis” tutorials
Google’s own Sheets learning center
Free courses on Coursera, edX, or LinkedIn Learning (often free via libraries)
2. SQL (Structured Query Language)
SQL is the most important technical skill for data analysts.
Learn to:
Write
SELECTqueries withWHERE,GROUP BY,ORDER BYUse joins (
INNER,LEFT,RIGHT)Aggregate data with
SUM,COUNT,AVG, etc.Filter, sort, and reshape data for analysis
Work with real databases (e.g., PostgreSQL, MySQL, SQLite)
Free resources:
SQLBolt, Khan Academy SQL, Mode Analytics SQL Tutorial
Free tiers of DataCamp, Dataquest, or Coursera’s “SQL for Data Science”
3. Data Visualization & BI Tools
Pick one BI tool to start: Power BI, Tableau, or Looker Studio.
Learn to:
Connect to data sources (Excel, CSV, SQL databases)
Build interactive dashboards
Create clear charts (bar, line, scatter, maps, KPIs)
Tell a story with data, not just show numbers
Free resources:
Microsoft Learn for Power BI
Tableau Public (free) + official tutorials
Google Looker Studio tutorials
4. Python (Optional but Highly Recommended)
Python helps you automate tasks, handle large datasets, and do more advanced analysis.
Focus on:
Basics: variables, data types, loops, functions
Libraries: pandas (data manipulation), numpy (numerical work), matplotlib/seaborn (visualization)
Simple analyses: cleaning data, aggregations, basic visualizations
You don’t need to be a software engineer—just comfortable enough to:
Load a CSV
Clean messy columns
Perform group‑by analyses
Save results or plots
Free resources:
“Python for Everybody” (free book/course)
freeCodeCamp’s Python for Data Analysis videos
Kaggle’s micro‑courses on Python and pandas
5. Statistics & Business Thinking
You don’t need a math degree, but basic statistics are essential.
Understand:
Mean, median, mode, standard deviation
Distributions and outliers
Correlation vs causation
Basic concepts of A/B testing and confidence
More important than heavy math: business thinking.
Ask:
What decision will this analysis support?
Which metric matters most to the business?
How can I make this insight actionable?
Step 2: Follow a Realistic 6–12 Month Learning Plan
You can go from zero to job‑ready in 6–12 months with consistent effort.
Months 1–2: Foundations
Master Excel/Google Sheets for data tasks
Start SQL basics (queries, filters, joins, aggregations)
Learn basic statistics concepts
Begin one BI tool (Power BI or Tableau)
Goal: Be able to take a raw CSV, clean it in Excel, query a simple database in SQL, and build a basic dashboard.
Months 3–4: Intermediate Skills + First Projects
Deepen SQL (subqueries, window functions basics)
Learn pandas for data cleaning and analysis in Python
Build 2–3 small projects:
Sales dashboard in Power BI
Customer analysis with SQL
Exploratory data analysis (EDA) in Python with visualizations
Goal: Have 2–3 presentable projects on GitHub or a simple portfolio site.
Months 5–8: Advanced Projects + Specialization
Tackle more complex projects using real‑world datasets
Add storytelling: write short case studies explaining your approach and insights
Optionally specialize:
Marketing analytics (campaign performance, funnel analysis)
Product analytics (user behavior, retention)
Finance/operations (forecasting, cost analysis)
Goal: 4–6 strong projects, at least 2 with clear business impact or realistic scenarios.
Months 9–12: Job Hunt Preparation
Polish your portfolio site (simple is fine: Carrd, Notion, GitHub Pages)
Optimize your resume and LinkedIn for “Data Analyst” keywords
Start applying for junior/entry‑level roles, internships, or freelance gigs
Practice common data analyst interview questions (SQL, case studies, dashboards)
Step 3: Build a Portfolio That Beats a Degree
Your portfolio is your “proof of skill.” Without a degree, it’s your most important asset.
What Should Your Portfolio Include?
Aim for 4–6 projects that show:
Data cleaning – taking messy data and making it usable
SQL analysis – querying a database to answer questions
Dashboards – interactive visuals in Power BI/Tableau/Looker
Python analysis – EDA or simple modeling with pandas
Business impact – clear explanation of insights and recommendations
Project Ideas (No Degree Required)
Sales performance dashboard
Use a public sales dataset
Show revenue by month, region, product
Add KPIs: total sales, growth rate, top products
Customer churn analysis
Analyze why customers leave
Segment by plan, region, usage
Suggest actions to reduce churn
Marketing campaign analysis
Compare campaigns by cost, CTR, conversions, ROI
Visualize performance over time
Recommend budget allocation
Nigeria/Africa‑focused project (great for differentiation)
Analyze Nigerian e‑commerce, logistics, or real estate data
Show local insights (e.g., “Which Lagos areas are undervalued?”)
Highlight your understanding of local business context
Host your projects on:
GitHub (code + README with insights)
A simple portfolio site (Carrd, Notion, Wix, or WordPress)
Tableau Public or Power BI web links for interactive dashboards
Step 4: Get Credible Certifications (Optional but Helpful)
Certificates won’t replace experience, but they can:
Structure your learning
Show commitment to employers
Help you rank better in job filters
Recommended options:
Google Data Analytics Certificate (Coursera)
Microsoft Power BI Data Analyst (PL‑300)
IBM Data Analyst Professional Certificate
Vendor‑specific SQL or Python certificates (DataCamp, Coursera, edX)
For Nigeria/Africa:
Look for scholarships or financial aid on Coursera/edX
Consider local bootcamps or online programs with career support
Step 5: Optimize Your Resume and LinkedIn for Data Analyst Roles
You’re competing with degree‑holders, so your profile must be crystal clear.
Resume Tips
Title yourself as “Aspiring Data Analyst” or “Junior Data Analyst”
Lead with a skills section: SQL, Excel, Python, Power BI/Tableau, Statistics
Add a projects section with 3–5 key projects and 1‑line impact each
Include certifications and relevant courses
Keep it to 1 page if you’re early‑career
LinkedIn Optimization
Headline: “Aspiring Data Analyst | SQL – Python – Power BI” (adjust to your tools)
About section: 3–5 lines on your journey, skills, and types of roles you want
Add projects with links and visuals
Follow companies and join groups like “Data Analysts,” “Nigeria Tech,” etc.
Post small updates: project screenshots, learnings, mini case studies
Step 6: Find Entry‑Level Jobs, Internships, and Freelance Work
You don’t need to land a “Senior Data Analyst” role immediately.
Target roles like:
Junior Data Analyst
Data Analyst Intern
Business Analyst (entry‑level)
Reporting Analyst / MIS Analyst
Marketing/Operations Analyst (junior)
Where to Look
Job boards: LinkedIn Jobs, Indeed, Glassdoor
Remote boards: We Work Remotely, Remote OK, FlexJobs
Africa‑focused: Jobberman, MyJobMag, LinkedIn filters for “Nigeria” or “Remote”
Freelance: Upwork, Fiverr, Toptal (for more experienced)
Don’t ignore:
Startups and SMEs (often more flexible on degrees)
NGOs and public sector (heavy reporting needs)
Internal moves: if you’re already working, ask to support data/reporting tasks
Step 7: Ace the Data Analyst Interview Without a Degree
Interviews usually test:
Technical skills – SQL queries, Excel tasks, basic Python
Case studies – “How would you analyze X?”
Portfolio walkthrough – explain your projects clearly
Communication – can you explain insights to non‑technical people?
How to Prepare
Practice SQL interview questions daily (LeetCode, HackerRank, StrataScratch)
Rehearse explaining 2–3 projects in simple language:
Problem
Data used
Tools and methods
Key insights and recommendations
Prepare answers for common questions:
“Tell me about a time you used data to solve a problem.”
“How do you handle missing or messy data?”
“Describe a dashboard you built and its impact.”
Your lack of a degree matters far less if you can:
Write clean SQL on the spot
Walk through a sharp, business‑focused project
Communicate clearly and confidently
Common Myths About Becoming a Data Analyst Without a Degree
Myth 1: “I need a computer science or math degree.”
Reality: Many successful analysts come from business, economics, social sciences, or are self‑taught. Skills and projects matter more.
Myth 2: “I must learn Python and machine learning first.”
Reality: For most entry‑level analyst roles, SQL + Excel + BI tool is enough. Python is a strong plus, not always required.
Myth 3: “I need expensive bootcamps to get hired.”
Reality: Plenty of analysts are hired after self‑study using free/low‑cost resources plus a solid portfolio. Bootcamps can help, but they’re not mandatory.
A Simple Weekly Plan (If You’re Starting From Zero)
Assume ~10–15 hours/week:
Monday–Wednesday (6–8 hours)
3–4 hours: SQL practice (tutorials + exercises)
2–3 hours: Excel/Power BI or Tableau tutorials
1 hour: Basic statistics concepts
Thursday–Friday (4–6 hours)
Work on a project:
Find a dataset
Clean it in Excel or Python
Analyze with SQL
Build a dashboard
Weekend (2–4 hours)
Write a short blog post or LinkedIn update about what you learned
Refine your portfolio site
Apply to 5–10 relevant jobs or internships
Repeat this for 6–12 months, and you’ll be competitive for junior roles—even without a degree.
Frequently Asked Questions (FAQ)
1. How long does it take to become a data analyst with no degree?
Most people can become job‑ready in 6–12 months with consistent study (10–15 hours/week) and a strong portfolio.
2. Do I need to learn Python to get a data analyst job?
Not always. Many entry‑level roles require SQL + Excel + a BI tool. Python is a strong advantage and increasingly expected, but you can land your first job without it and learn on the way.
3. Which is better: Power BI or Tableau?
Both are widely used.
Power BI integrates well with Microsoft tools and is popular in many companies.
Tableau is strong in visualization flexibility and is common in larger enterprises.
Pick one, master it, then you can learn the other more easily.
4. Can I get a remote data analyst job without a degree?
Yes. Many remote and startup roles focus on skills and portfolios. Highlight your projects, GitHub, and measurable impact to improve your chances.
5. I’m in Nigeria/Africa. Does this roadmap still work?
Absolutely. The same core skills apply globally. Localize your projects (Nigerian sales, logistics, e‑commerce, real estate data) to stand out and show business understanding.
Final Takeaway
You do not need a degree to become a data analyst in 2026. You need:
Focused skills: SQL, Excel, a BI tool, and ideally Python
A portfolio of 4–6 real projects
A clear story about how you use data to solve problems
Consistent effort over 6–12 months



No responses yet